David's (BT) data blog
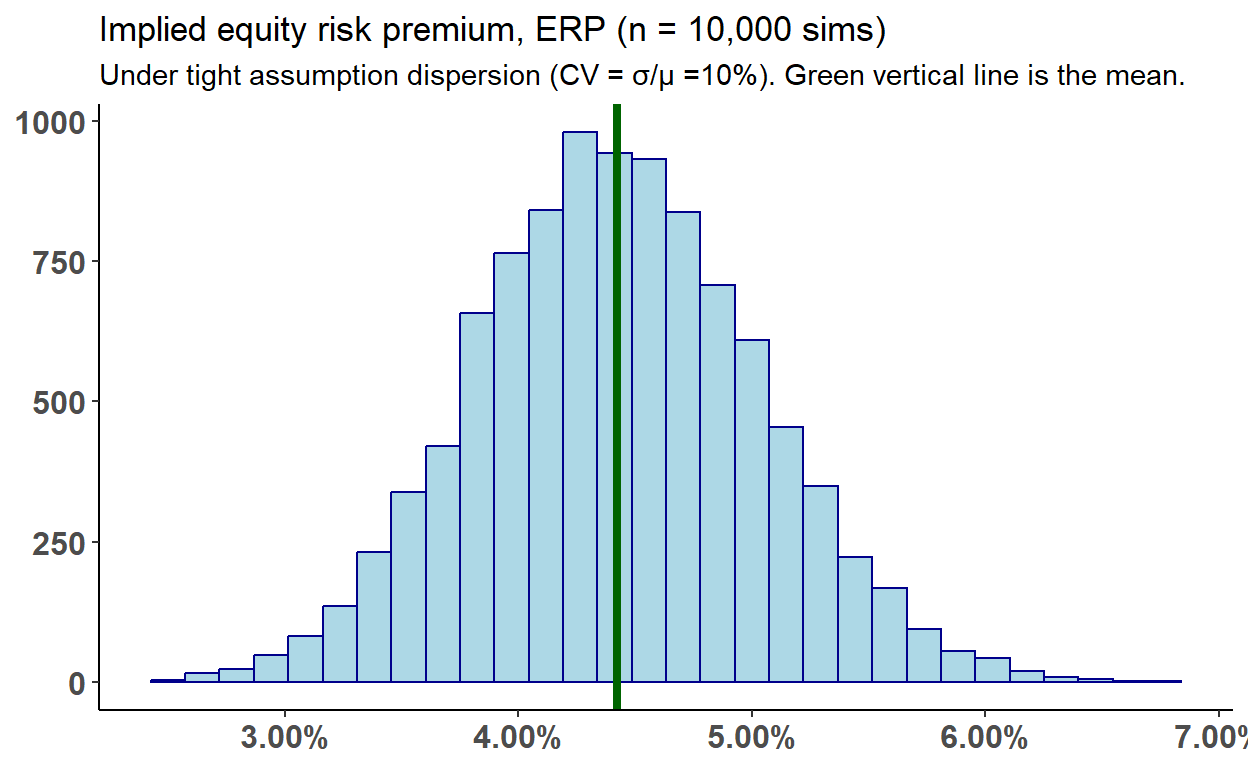
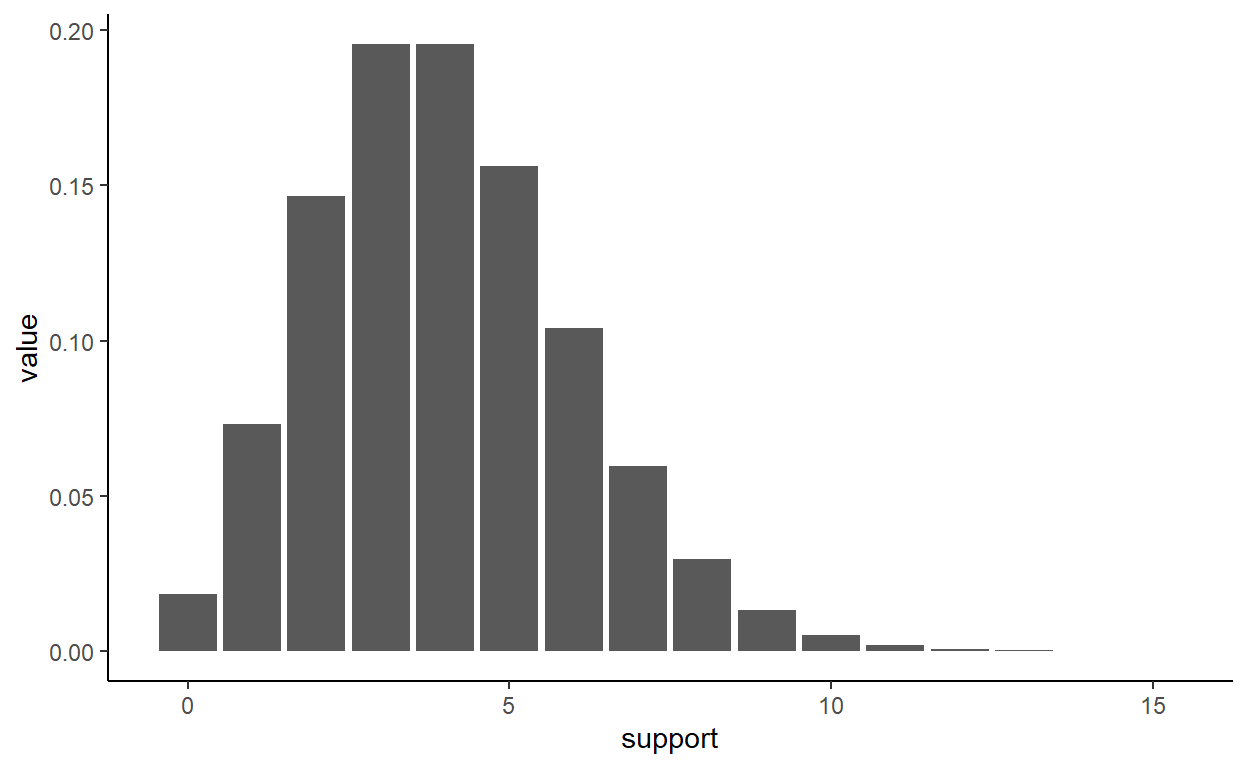
Simulating the equity risk premium
The implied ERP is very sensitive to assumptions, in particular G2
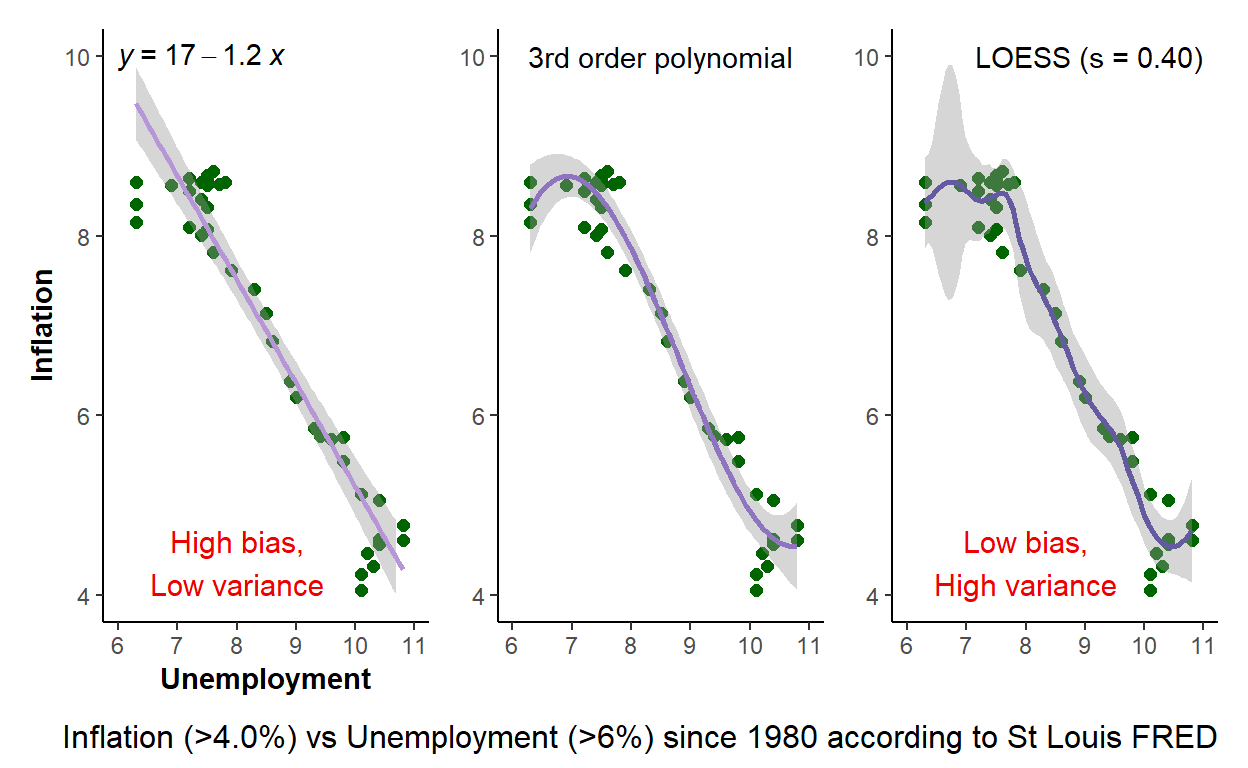
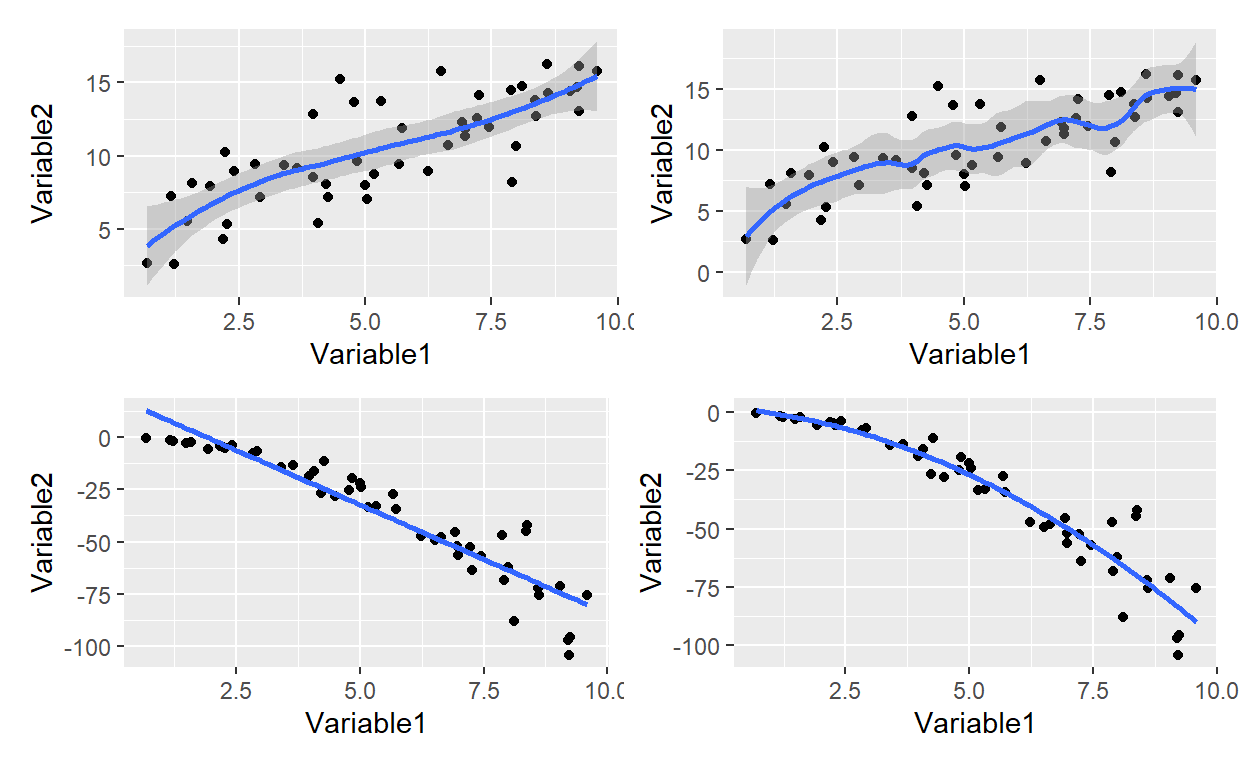
Phillips curve to illustrate bias-variance tradeoff
Underfitting implies low-variance but high-bias; overfitting implies low-bias but high variance
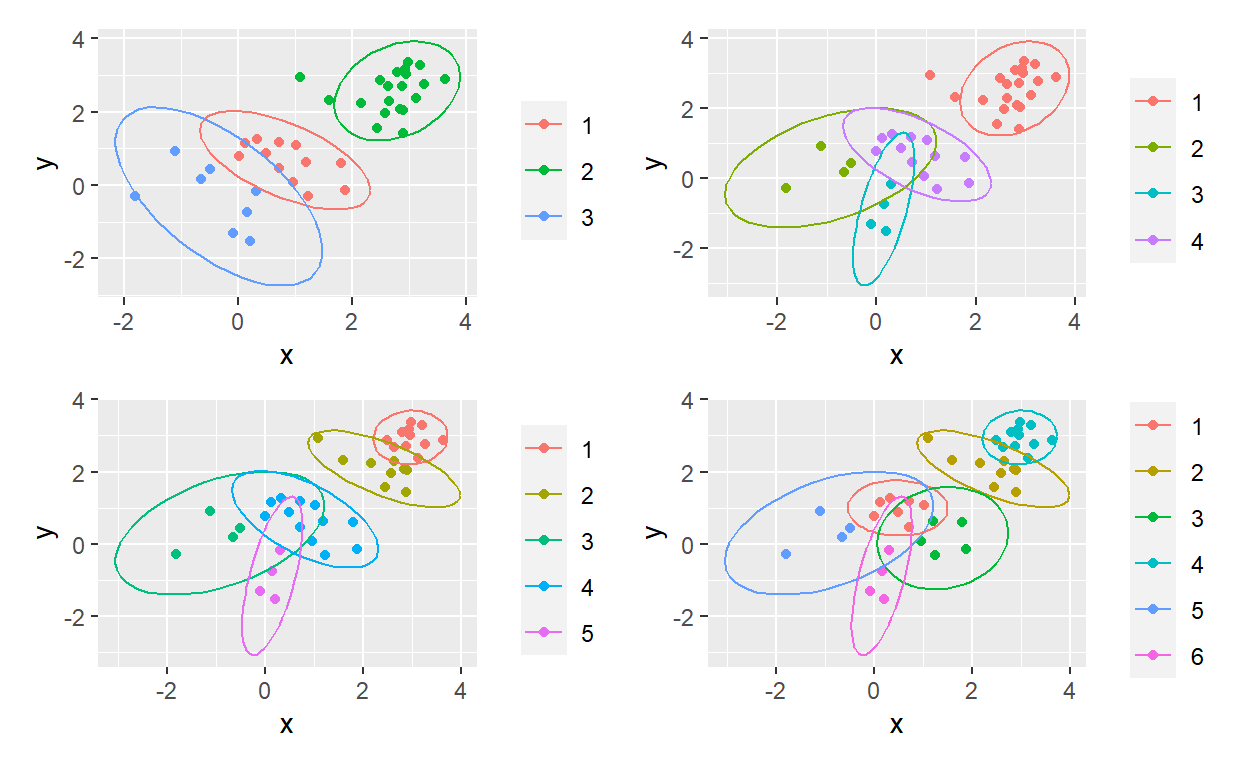
Using purrr to map over a range of k-means clusters
Mapping a k-means factory
Intermediate Functional Programming with purrr
My progress in learning how to purrr
Advanced Data Visualization with R at JH
The sequel in the JH dataviz specialization
Foundations of purrr
Map over list elements with elegance and power
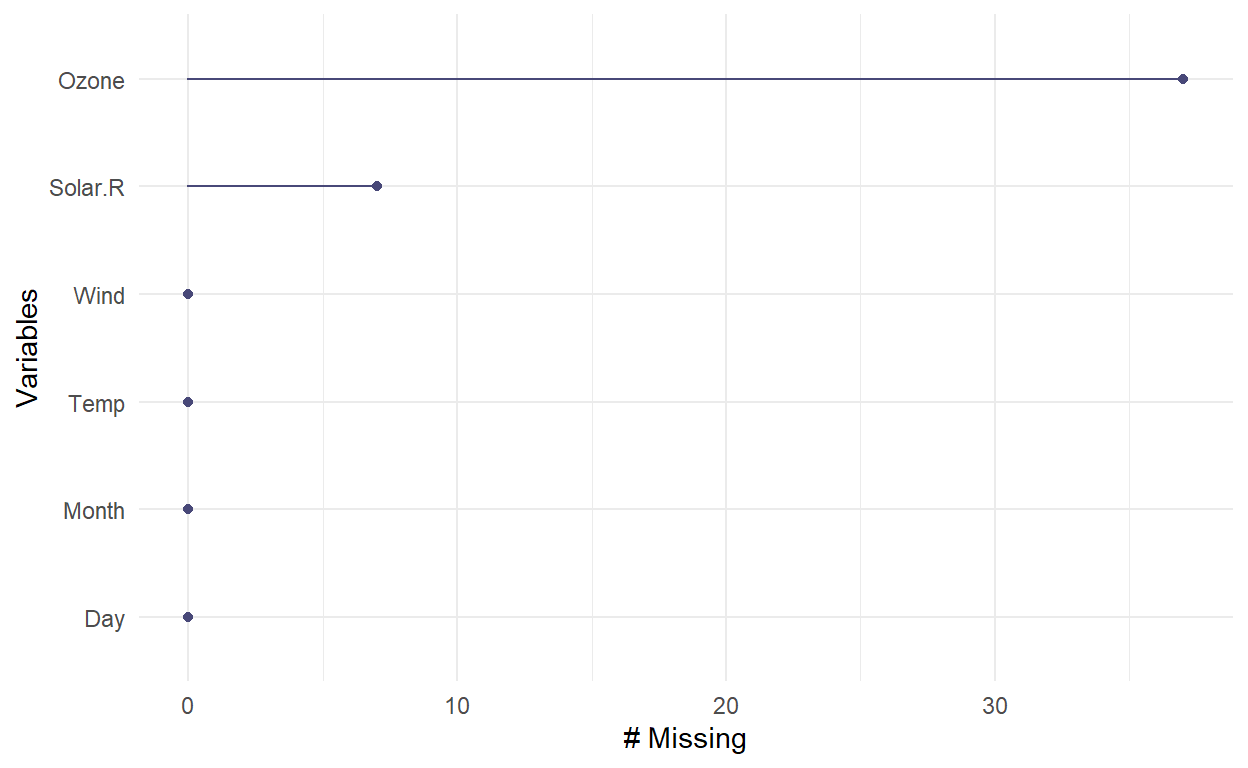
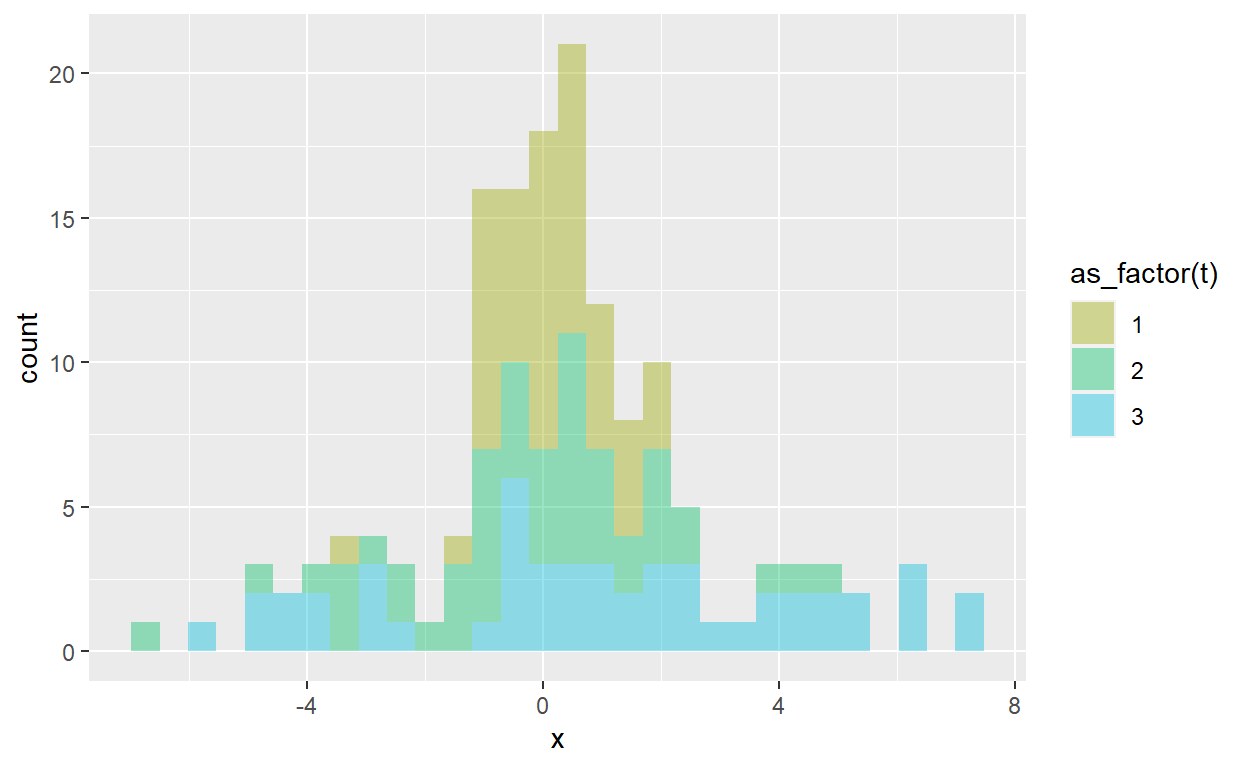
How to Process Missing Data
How do we visualize what's missing? And the art of imputation
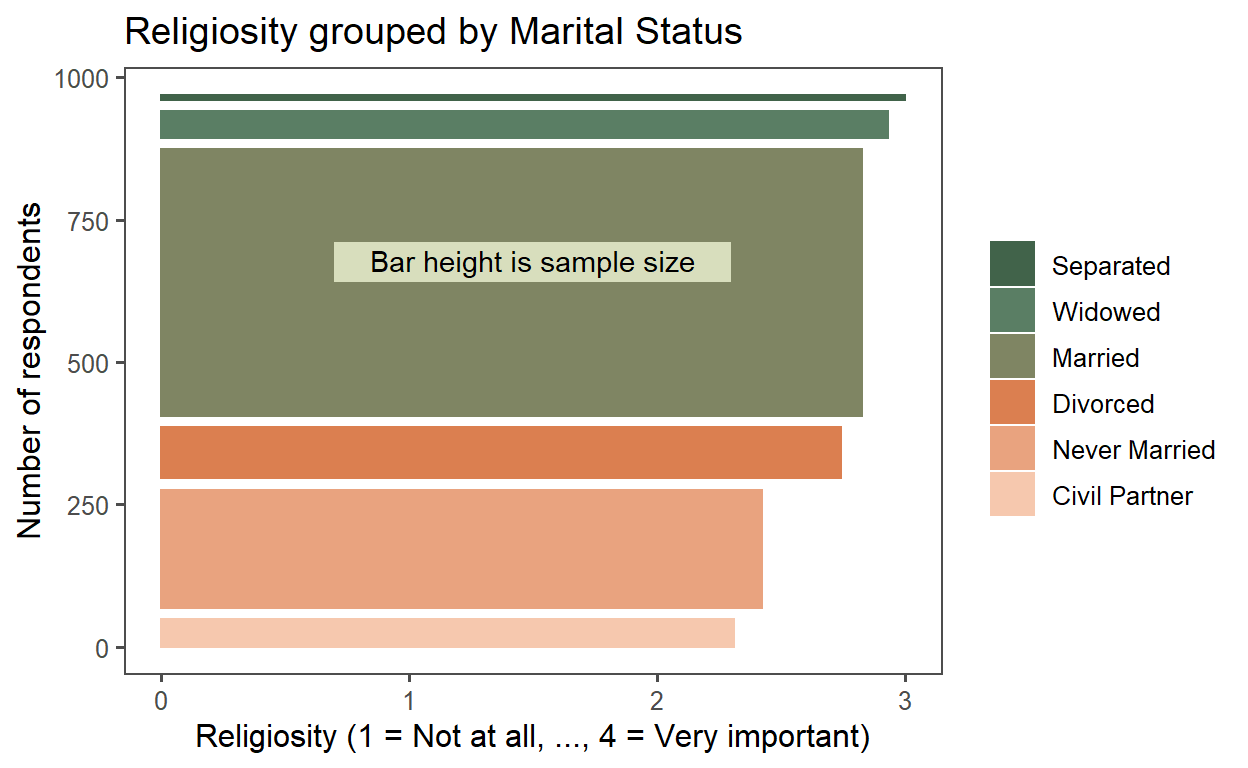
My JH dataviz submission
Product of JH's DataViz in R with ggplot2.
Example of embedded Excel snippet
Excel workbook (or ranges) can be embedded in the classic iframe

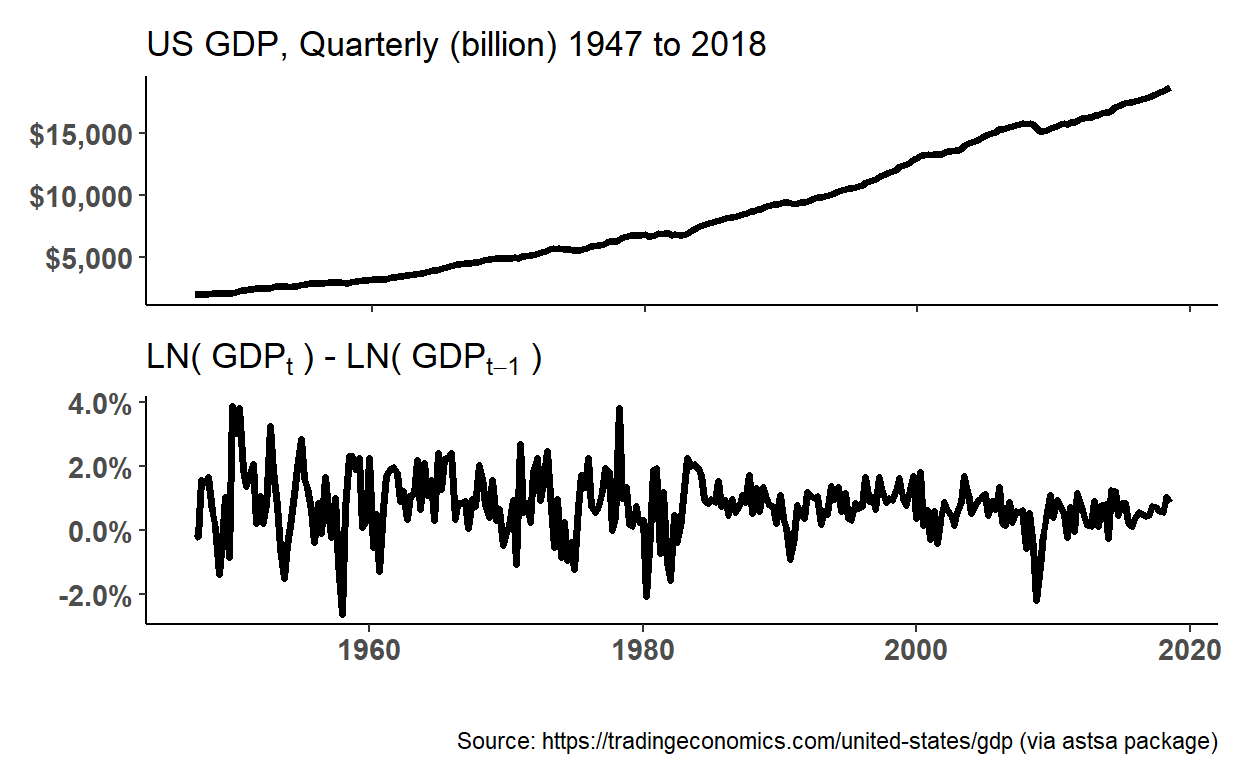
BT PQ P1.T2.21.1 (SET) Non-stationary time series (2021)
Seasonal dummy model, roots of characteristic equation, and transformation (difference versus detrend) of non-stationary process

BT PQ P1.T2.20.25 (SET) Long-horizon AR(p) MA(q) forecasts
The long-run mean of an MA(q) process is the intercept; of the AR(p) process is delta/(1 - sum of params)
BT PQ P1.T2.20.24.3 AIC and BIC
Penalized MSE measures are called information criteria (IC) and two popular such measures are the Akaike Information Crite-rion (AIC) and the Bayesian Information Criterion (BIC).
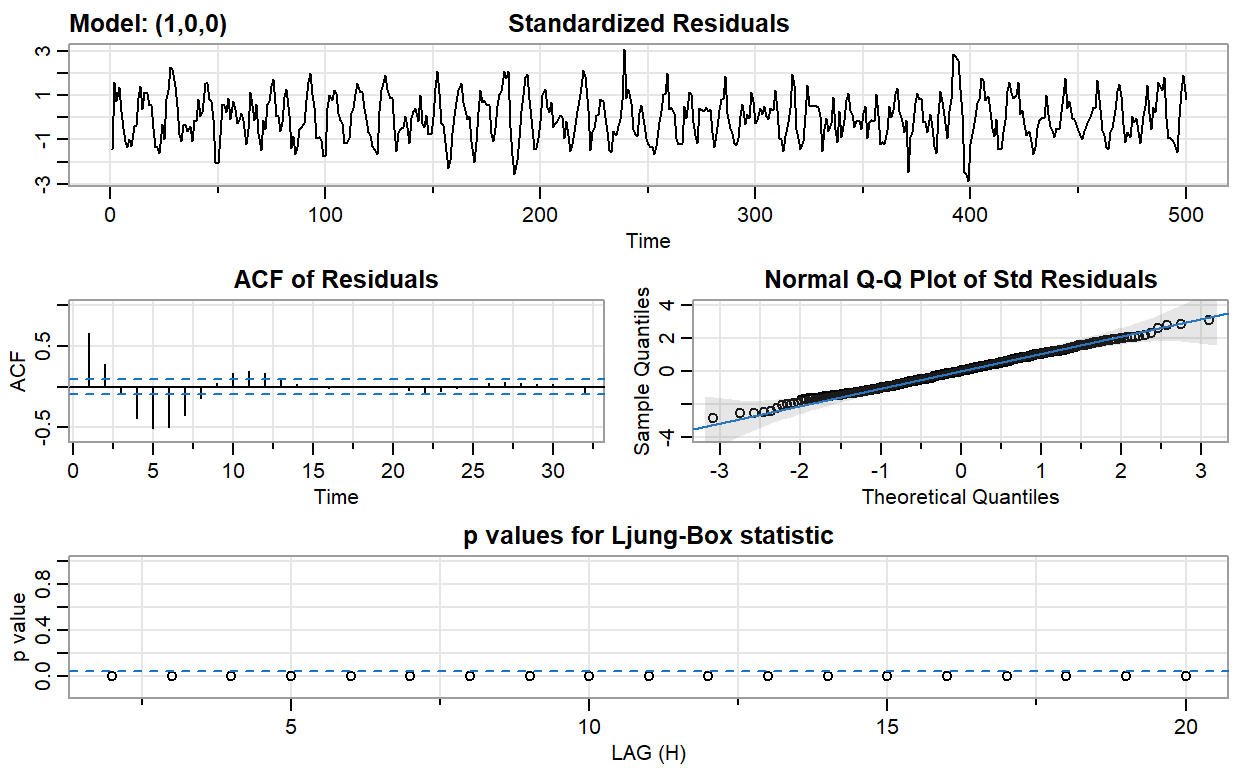
BT PQ P1.T2.20.24.2 Box-Pierce and the Ljung-Box tests
The Box-Pierce statistic is a simplified version of the Ljung-Box statistic; both are joint tests of autocorrelation
BT PQ P1.T2.20.23 (SET) autoregressive moving average (ARMA) models
ARMA(p,q) combines an AR(p) and MA(q)
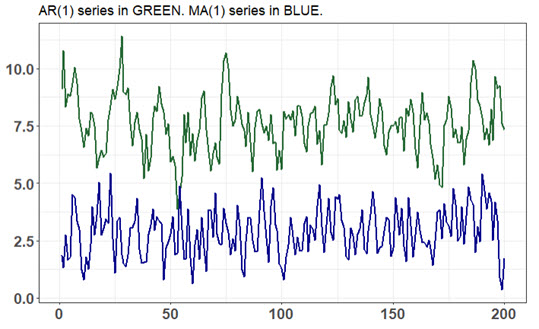
BT PQ P1.T2.20.22.2 autoregressive (AR) versus moving average (MA) process
What's the difference between and AR and MA process, when they appear to be similar?
BT PQ P1.T2.20.21.3 White Noise (WN) Process
White noise (WN) is the basic time series building block
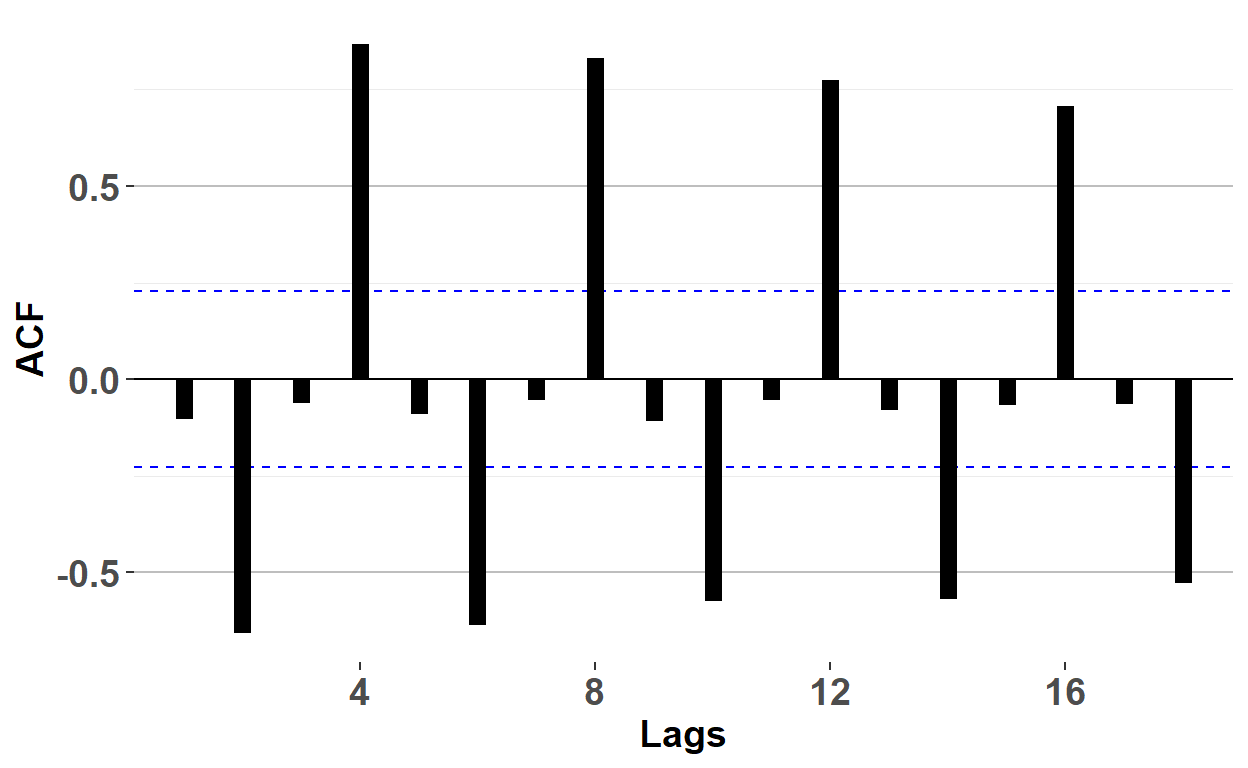
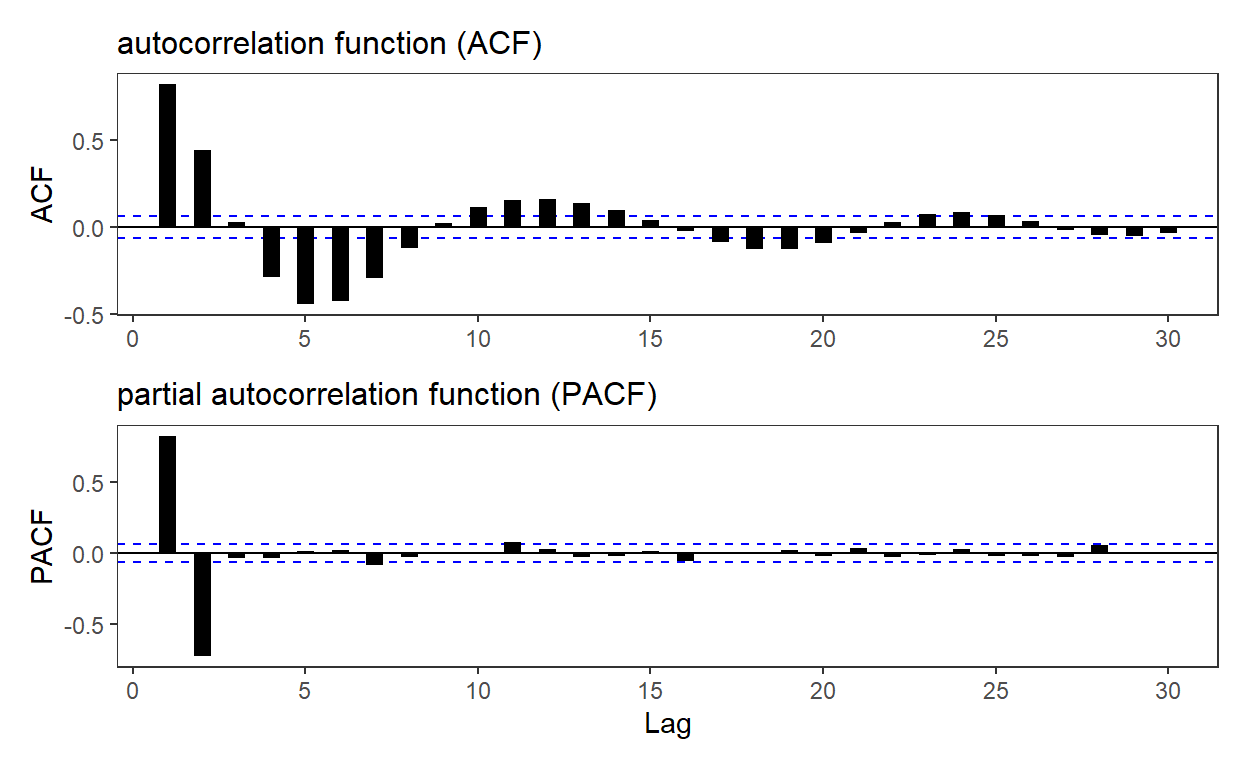
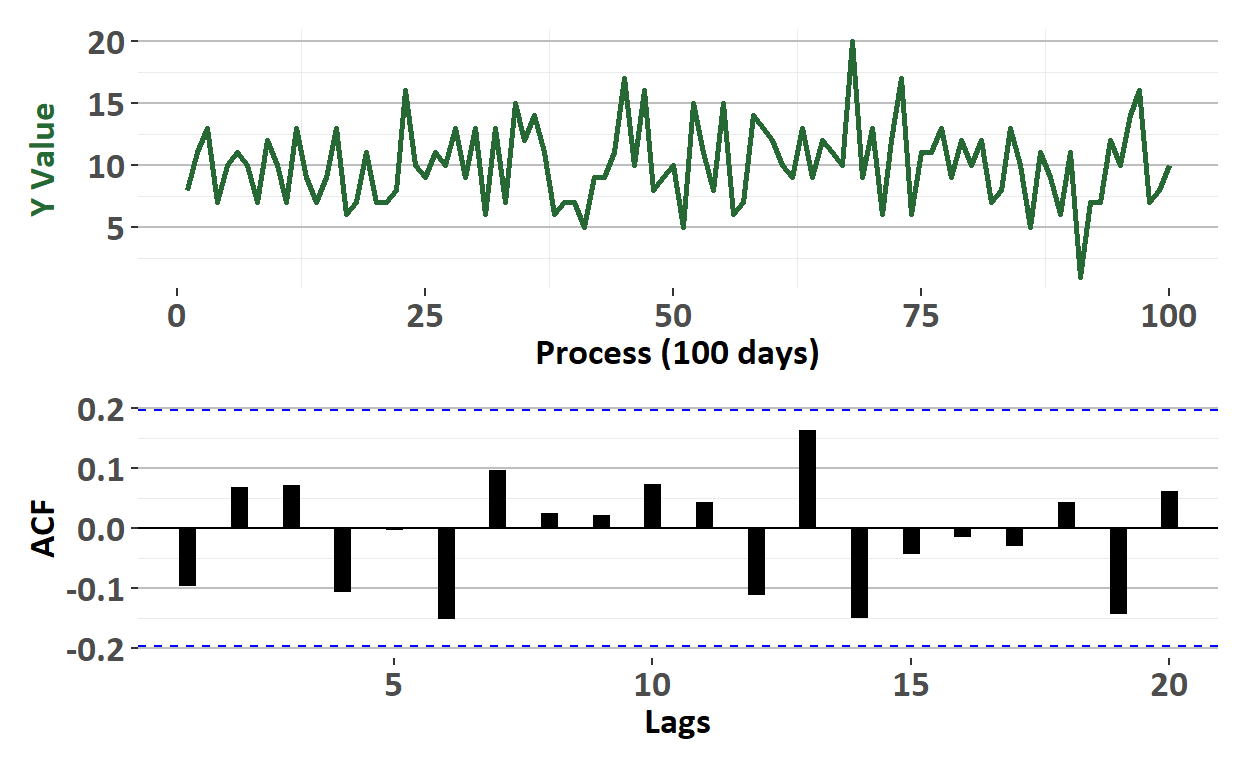
BT PQ P1.T2.20.21.2 Autocorrelation function (ACF)
The autocorrelation function (ACF; aka, correlogram) plots autocorrelation coefficients
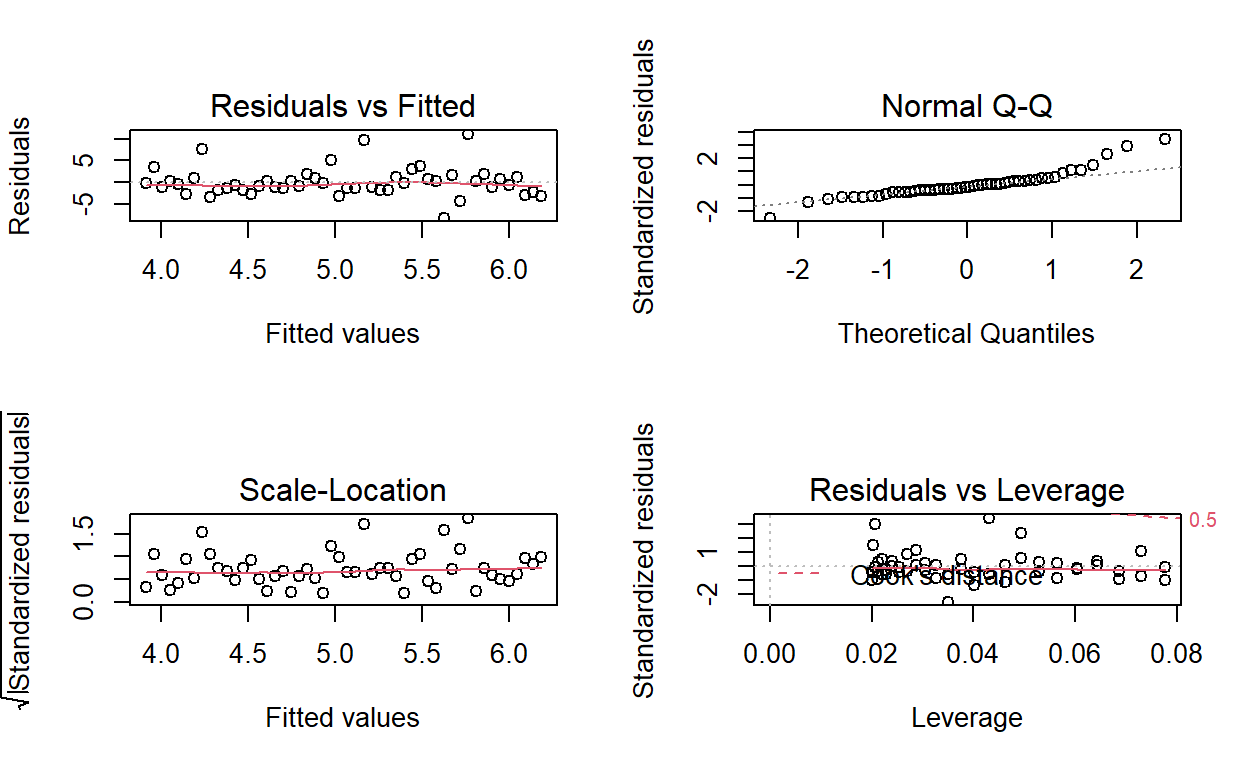
BT PQ P1.T2.20.20.3 Regression residual plost
standard lm() diagnostic plots: residual vs fitted, normal Q-Q, scale-location, residuals vs levereage
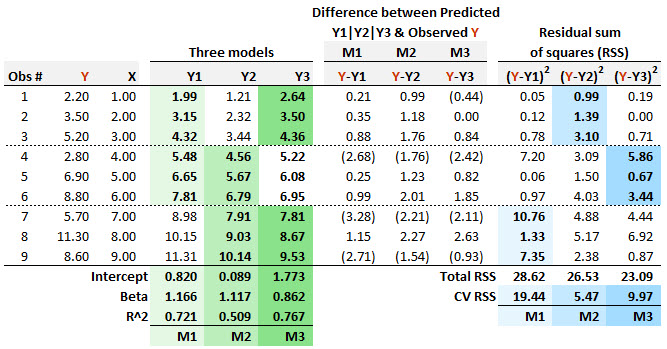
BT PQ P1.T2.20.20.2 Regression diagnostics: m-fold cross-validation (CV)
m-fold cross validation is for model checking, not model building
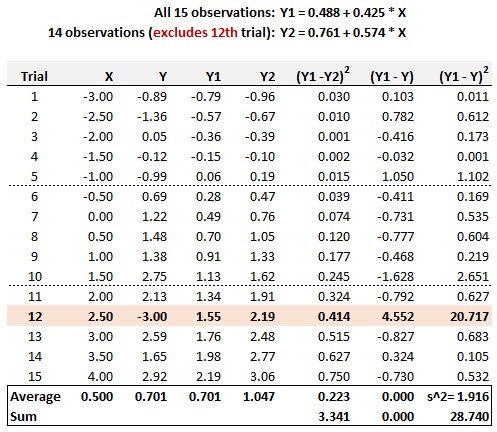
BT PQ P1.T2.20.20.1 Regression diagnostics: Cook's distance
Cook's distance evaluates an outlier

BT PQ P1-T2-20-19: Regression diagnostics (SET)
Diagnostics: omitted variable bias, heteroskedasticity, and multicollinearity

BT PQ P1-T2-20-18 (SET) Multivariate regressions
Fama-French three-factor model; House prices; and Medical costs
BT PQ P1-T2-20-17. Univariate regressions cont (2nd set v2)
Coefficient confidence interval (CI); hypothesis test; interpretation of SE, t-stat and p-value
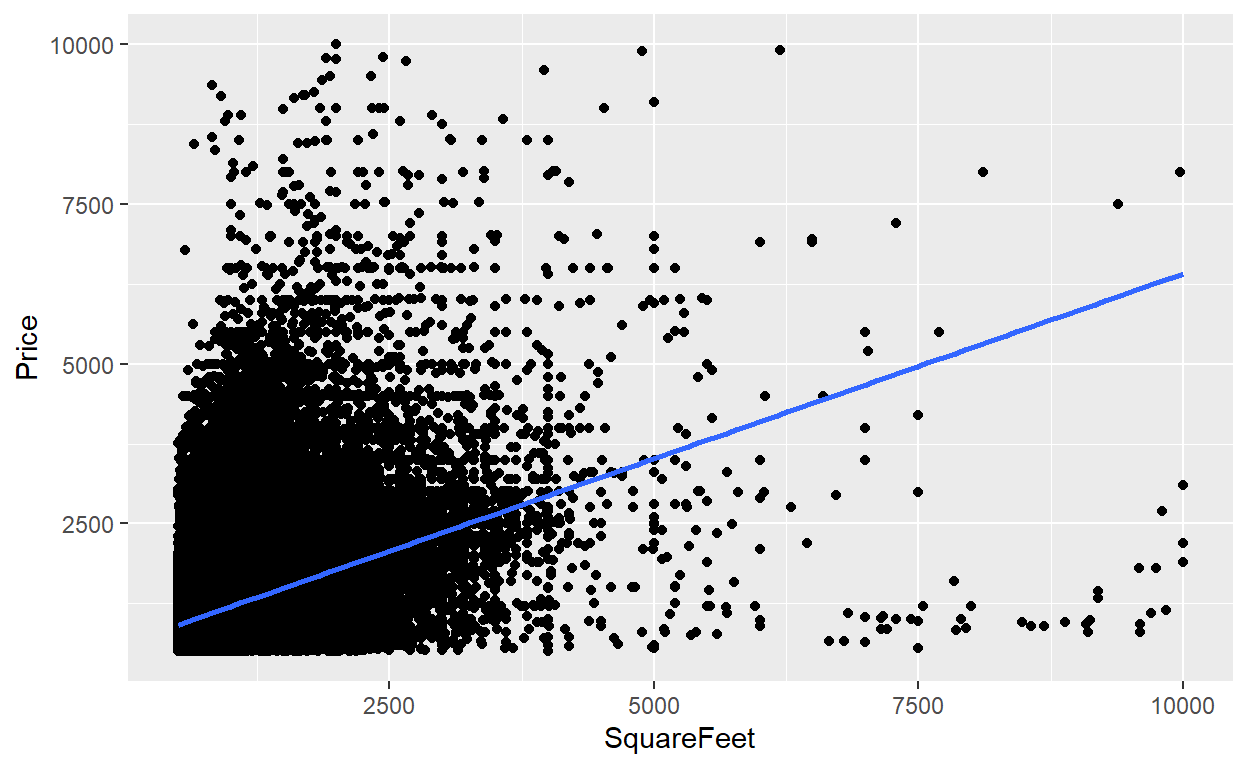
BT PQ P1-T2-20-16-3: Univariate regression: Monthly rental versus footage
Monthly rent against feet^2 per kaggle dataset
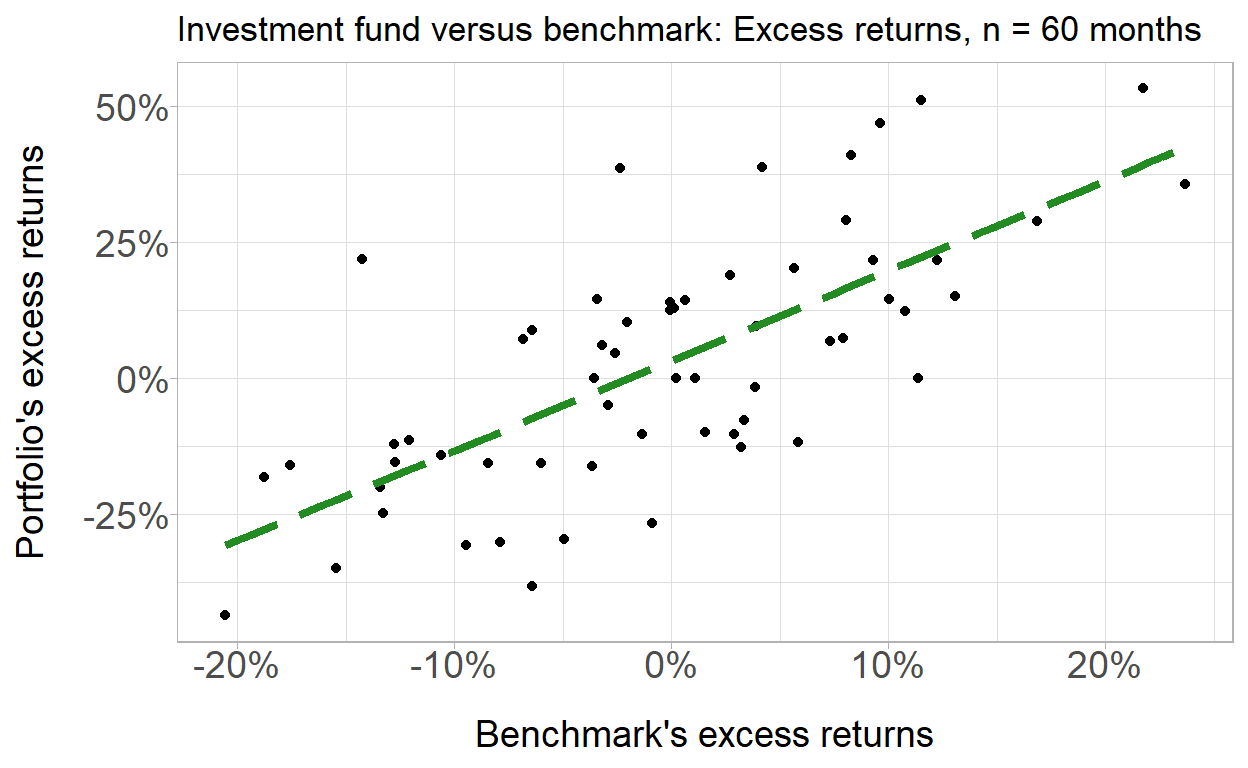
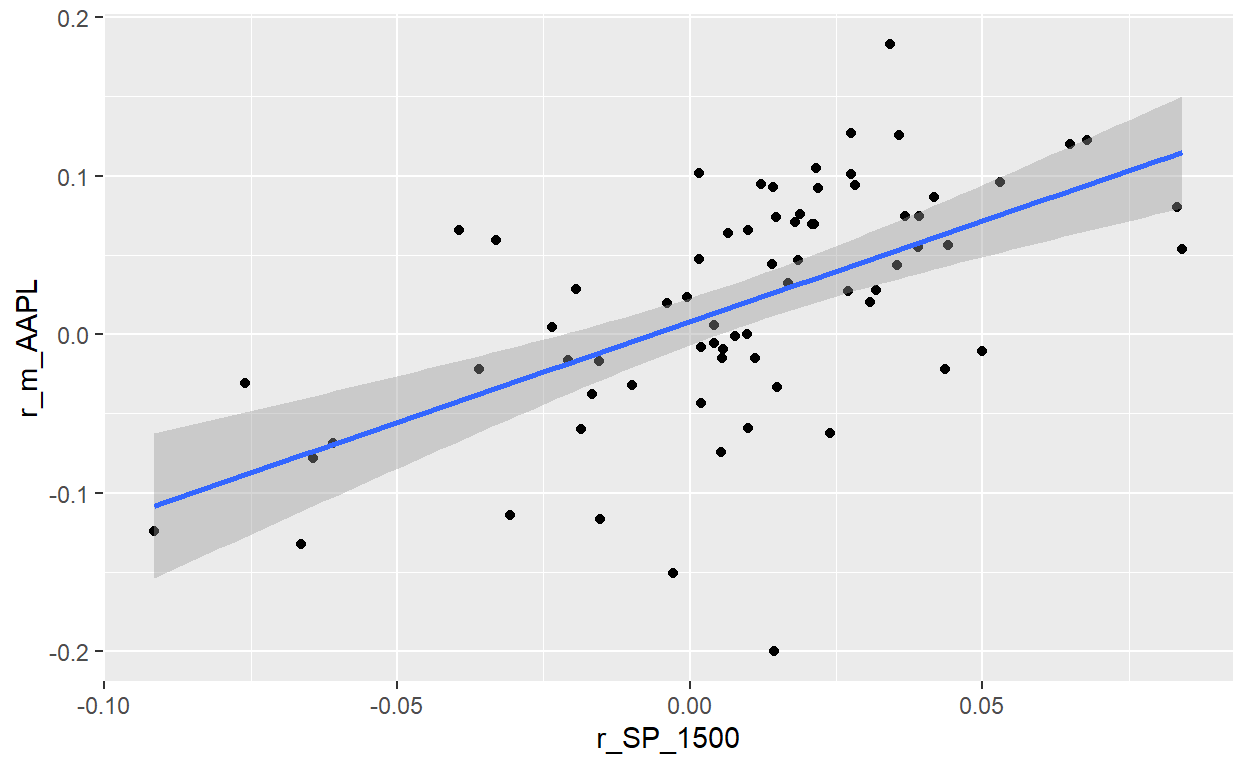
BT PQ P1-T2-20-16-2: Univariate regression: Portfolio versus benchmark returns
Simulated portfolio & benchmark for purposes of testing basic features of univariate regression
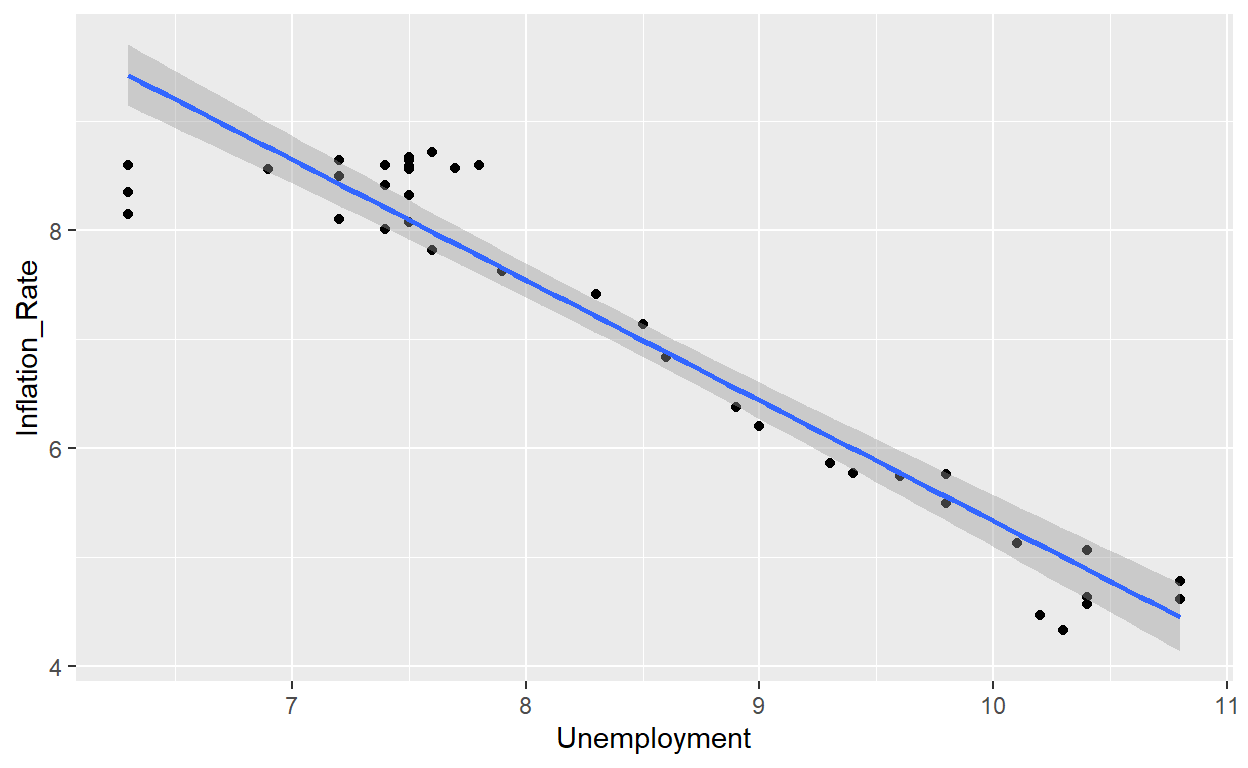
BT PQ P1-T2-20-16-1: Univariate regression: Inflation versus unemployment
With FRED data and applying gt_table
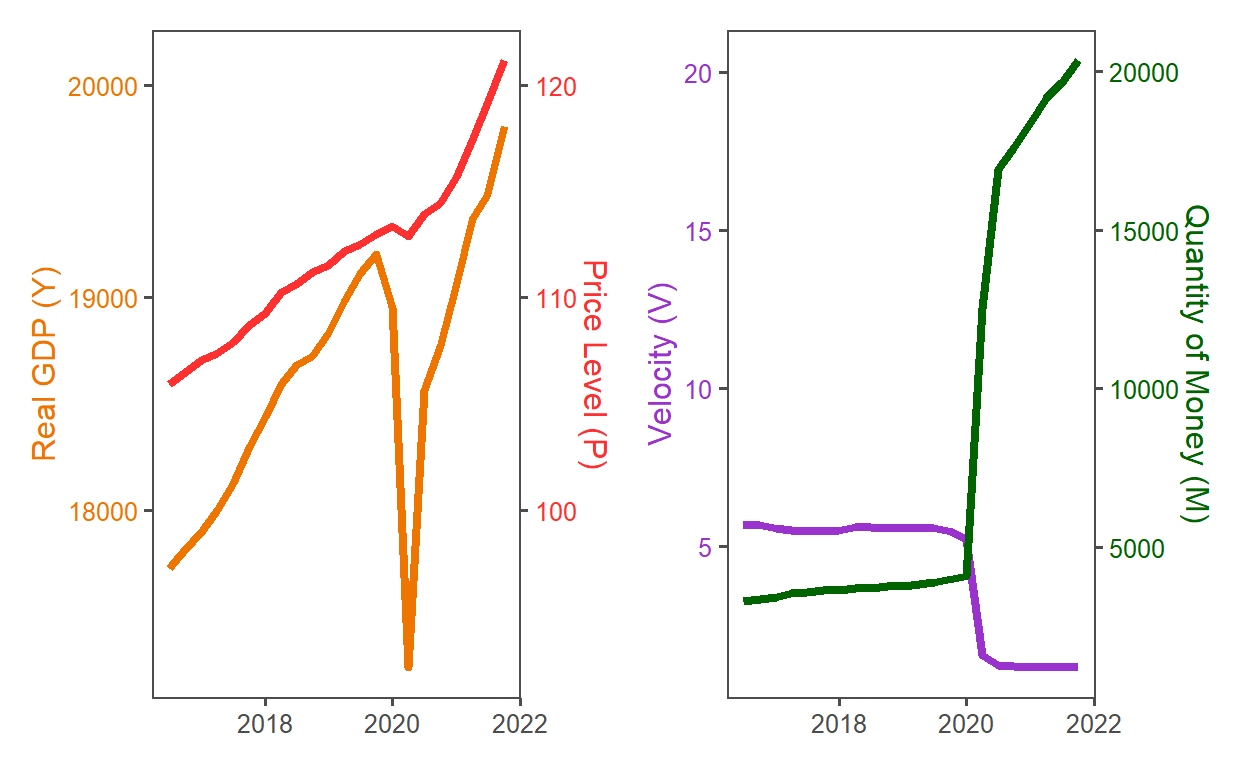
velocity of money
MV = PY illustrates the problem but is tautological

New distill site in 15 minutes
Distill is so much easier than blogdown