BT 20.21.2. Shown below is the autocorrelation function (ACF) for a time series object that contains the total quarterly beer production in Australia (in megalitres) from 1956:Q1 to 2010:Q2 (source: https://cran.r-project.org/web/packages/fpp2/index.html).
library(forecast)
# install.packages("fpp2")
library(fpp2)
beer2 <- ausbeer
beer2 <- window(ausbeer, start=1992)

acf_beer2 <- ggAcf(beer2) +
  xlab("Lags") +
  theme_bw() +
  geom_segment(size = 3) +
  theme(
    text = element_text(family = "Calibri"),
    plot.title = element_blank(),
    axis.title.x = element_text(size = 14, face = "bold"),
    axis.title.y = element_text(size = 14, face = "bold"),
    axis.text.x = element_text(size = 14, face = "bold"),
    axis.text.y = element_text(size = 14, face= "bold"),
    panel.grid.major.x = element_blank(),
    panel.grid.major.y = element_line(color="grey"),
    panel.border = element_blank()
  )

acf_beer2
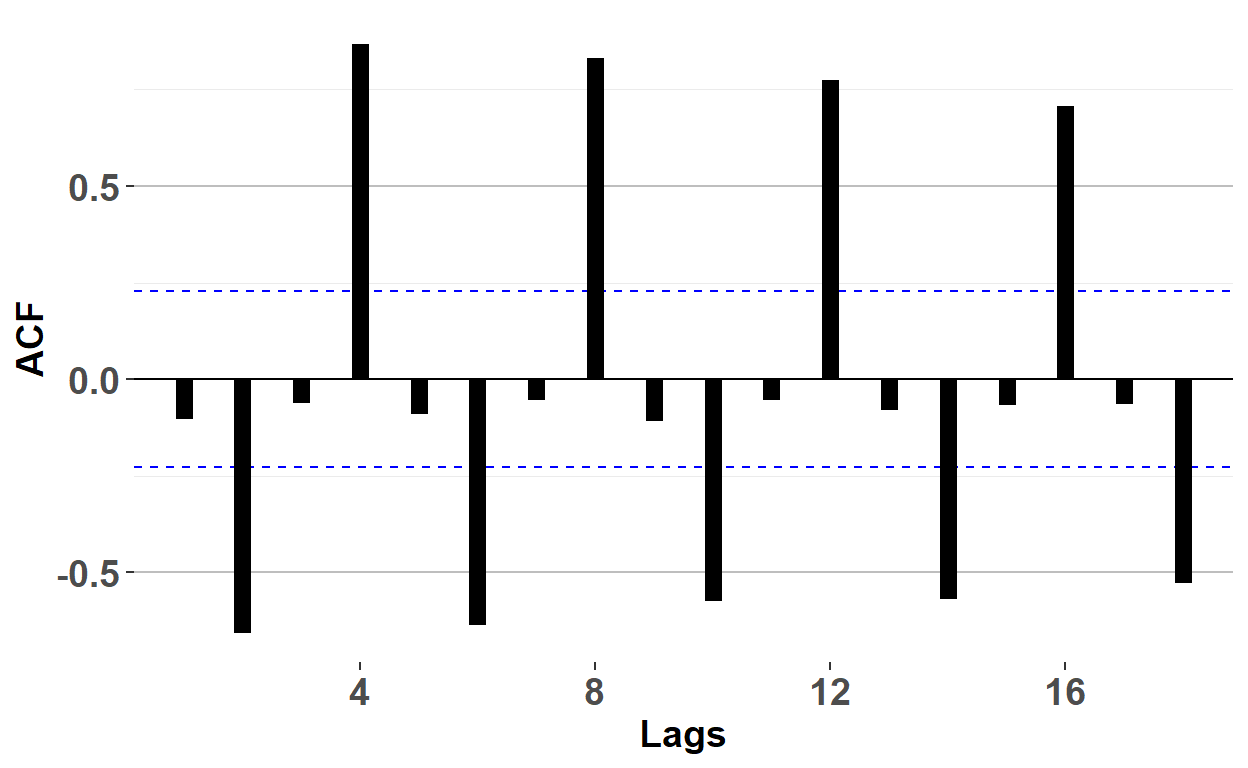
About this ACF and its implications, each of the following statements is true EXCEPT which statement is false?
- ρ(1) and ρ(3) are insignificant
- This time series is a white noise process
- This ACF is compatible with a seasonal time series
- If this time series exhibits stochastic seasonality, it might be possible to fit a seasonal ARMA model
End of post