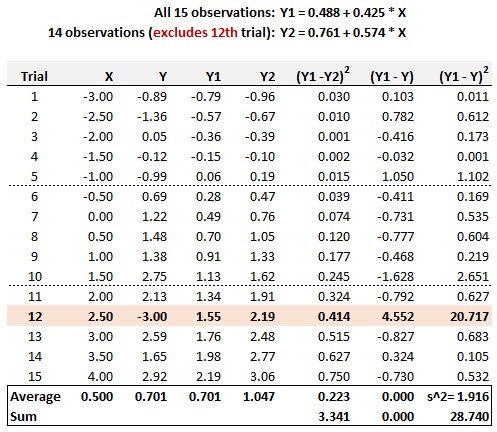
20.20.1. Below are displayed 15 pairwise (X,Y) trials. The simple regression line based on all 15 observations is given by Y1 = 0.488 + 0.425*X. We consider the possibility that the 12th Trial, given by point (X = 2.50, Y = -3.00) might be an outlier. If this point is removed, then the regression based on the other 14 observations is given by Y2 = 0.761 + 0.574*X. These results are displayed, including selected summary statistics.
According to Cook’s distance, is the 12th Trial an outlier?
- No, because its Cook’s distance is negative
- No, because its Cook’s distance is 3.341/(2*1.916) = 0.872
- Yes, because its Cook’s distance is +0.15 (as given by the slope change)
- Yes, because its Cook’s distance is 1.916/(2*0.223) = +4.301
Cook’s distance measures the sensitivity of the fitted values to dropping a single observation and is given as follows by D(j)
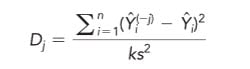
In this case, the numerator is displayed on the given table (i.e., 3.341), and also displayed is the estimate of the error variance, s^2 = 1.916. As this is univariate regression, k = 2 coefficients. The Cook’s distance is therefore given by 3.341/(1.916*2) = 0.872. Because this is less than 1.0, we do not view the 12th trial as an outlier.